Discover3D can not only display mining package block models and create voxel models, it also has the ability to export voxel models as vector slices along multiple cross-sections. These vector slices are automatically associated with the cross-sections (i.e. automatically recognised and handled by the Section Manager), and comprise a polygon for each intersected voxel cell, attributed with that voxel cell's value.
This capability therefore opens a wealth of further analytical options within your 2D drillhole cross-sections. For example, resource calculations assisted via clipping these voxel slice polygons to interpreted high grade regions, or converting these vector slices into gridded surfaces for more advanced visualisation (e.g. contouring) and analysis.
Example
For instance, this functionality allows you to effortlessly take a 3D voxel model of say Cu mineralisation, such as :
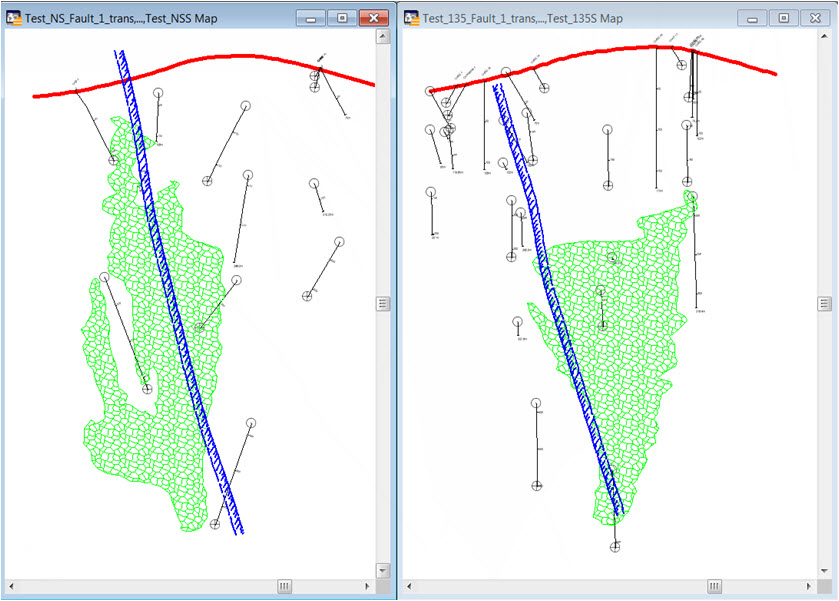
And slice / intersect them across multiple 2D sections, producing attributed polygons representing the sliced voxel cells on a per section basis:
Solution
1/. Ensure the target cross-sections are already opeedn in a drillhole project in MapInfo Pro/Discover (via the Section Manager).
2/. Open the voxel / block model in Discover 3D (Display > Voxel Model, then use the Load Model Wizard option under the File tab).
3/. Still in the Voxel Model Properties dialog, go to the Slices tab, enable the Show option (1) for Custom slices, then press the Section button (2)
4/. Select the desired target cross-sections from the following dialog, and press OK:
5/. Back in the main Voxel Model Properties dialog, press Apply to visualise these slices in 3D:
6/. Open the File tab, and press the Export Model Wizard button
7/. Select the Section slices to vector files option, then Next and Finish.
8/. Once the final confirmation dialog appears indicating that your section slices have been output, change to the MI Pro/Discover 2D environment, and check your target cross-sections; these should now be each populated with an additional vector layer representing the intersected voxel model.
9/. Note that these vector layers are rich in information, comprising individual attributed polygons reflecting the source voxel cell values:
Advanced options
The sectional voxel slices can be converted into gridded surfaces, further extending your visualisation and analytical options.
1/. In MapInfo Pro/Discover, open the Surfaces menu, and select the Vector to Grid menu option.
2/. Leave the Vector file option as '2D', and browse for the input vector file (the voxel slice layer) in the cross-section folder (under the drillhole projects root directory):
3/. Under Processing options, set the Overlay value as 'From field', and assign the correct voxel cell value field as the Overlay field.
4/. Some refinement of the other dialog options will be needed to achieve the required output, such as the grid cell size (recommend checking the voxel cell sizes back in Discover 3D).
5/. To ensure the visual colour scheme is consistent across multiple sections with grids created this way, experiment with the Surfaces>Modify Grid Display tool. You will likely need to create a Colur Display constrained by Value Breaks.


