The Create Pierce Point Layer tool is found within the Section Manager -
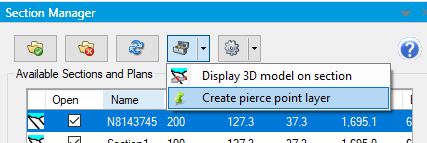
This converts downhole intervals into attributed MapInfo Professional Point symbols. This significantly enhances the display and analytical options for this data on long- and cross-sections, such as:
A range of label positions for composited intervals, such as created with the Downhole Object Clip tool. Pierce points can be created at the top, mid-point, or bottom of an interval; the shallowest of deepest RL; or the location closest to or furthest from the viewer.
Use of MapInfo Pro symbols to highlight and reinforce particular intercepts (for instance, locations where boreholes have intercepted an aquifer/watertable)
Thematic mapping or geochemical data classification of pierce points (derived from clipped to 3D volume and/or composited intervals) allows for the powerful and effective display of high grade (or grams per meter) intercept values.
Surface gridding / interpolation of pierce points values (such as grade or gram/meter values) extends the advanced analysis and trend interpretation options, including resource calculations.
Some examples of the various pierce point outputs, and the display and analysis options they provide:
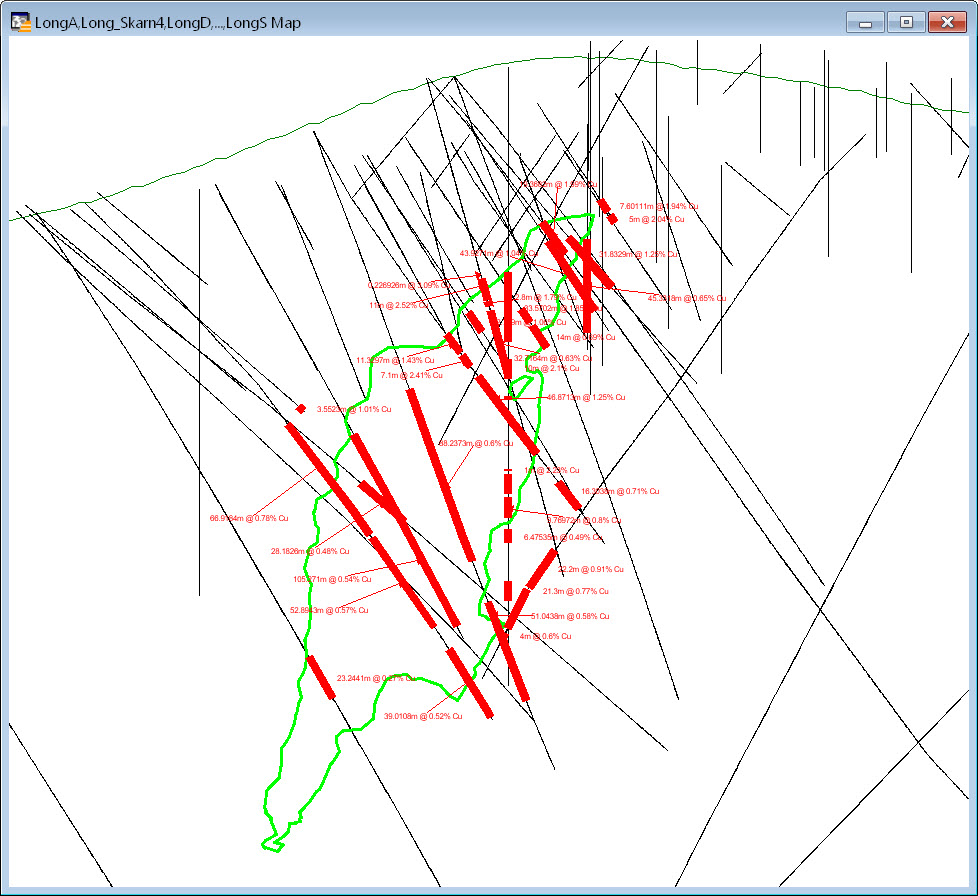
(1) Using a source file of downhole assays clipped to an orebody volume and then Composited by Cut-Off Grade, resulting in discrete high-grade intercepts.
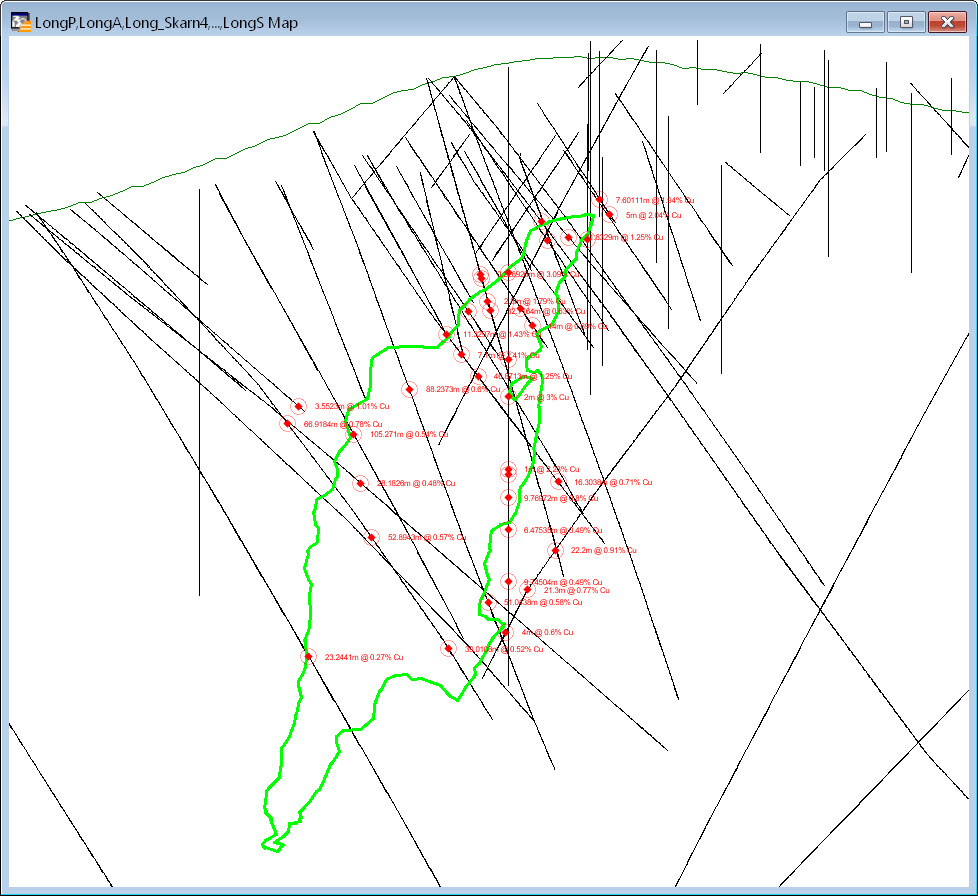
(2) Converting (1) into pierce points located at the top of each high-grade intercept for long-section display and labelling of the intercepts.
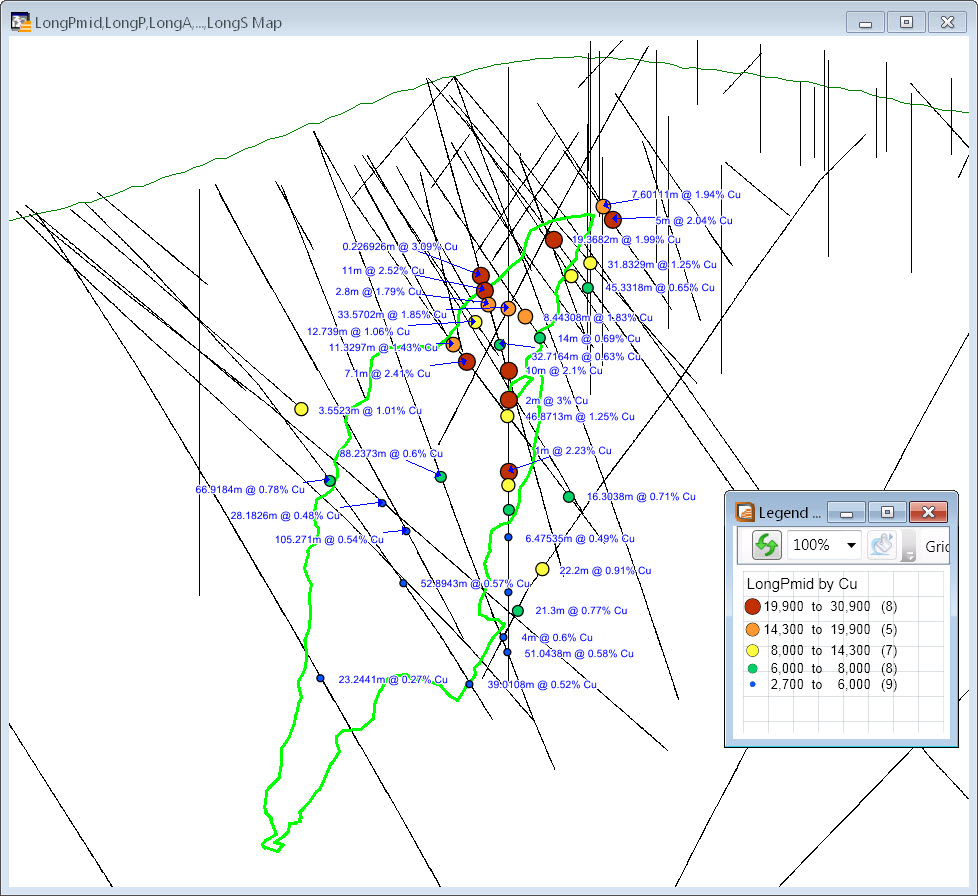
(3) Thematically mapping the mid-point pierce points of the same high-grade intervals by Cu% provides a visually powerful and informative summary of the drilling results.
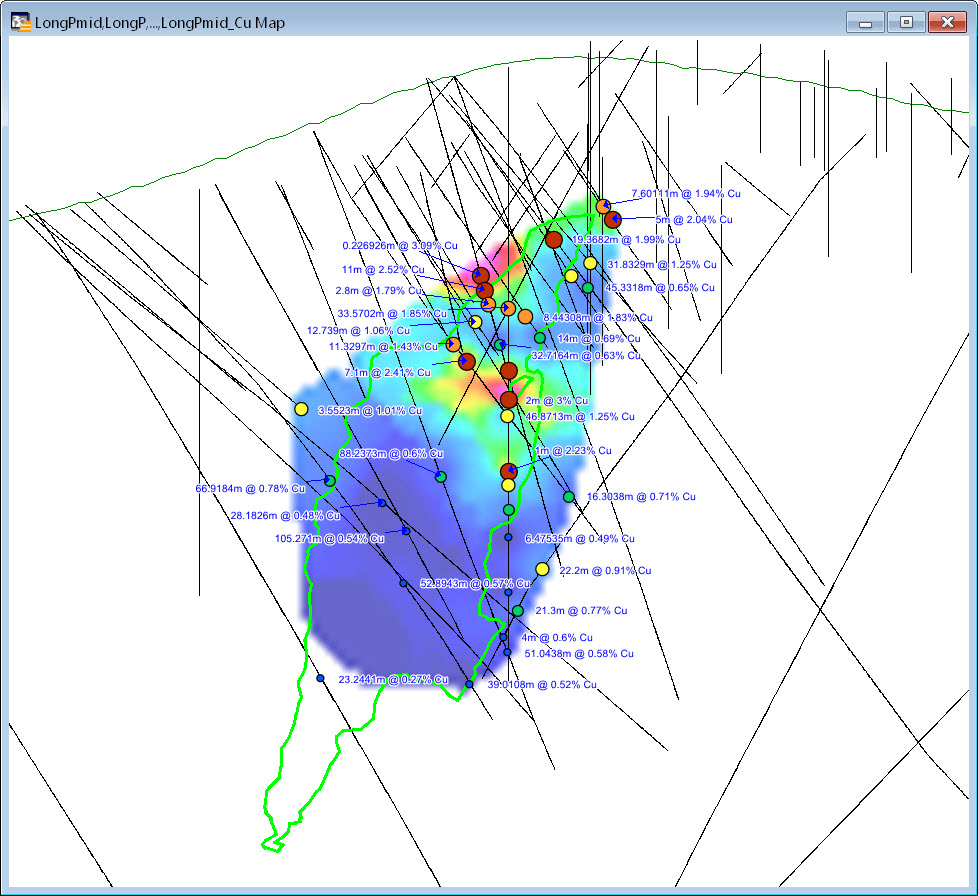
(4) Grid interpolation of the pierce points extends the analytical and interpretation options.


