Occurrence
Are you trying create and effectively display high-grade intercepts on your cross-sections and long-sections? Here are some pro-tips.
Solution
1/. Ensure you have composited your downhole assay table with the appropriate method / parameters (using Drillholes>Downhole Compositing). For instance, you may have composited the Au field with By Cut-Off Grade, using a cut-off value of 0.5g/t, and a minimum length of 5m. Also ensure that the resulting composited table is automatically added to the drillhole project by enabling the following option (the project will be re-cached during this process).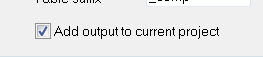
The resulting composited table may look similar in structure to this: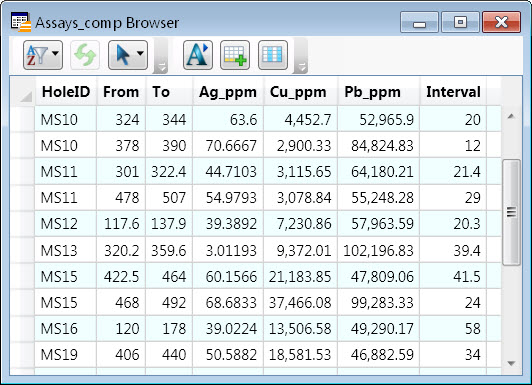
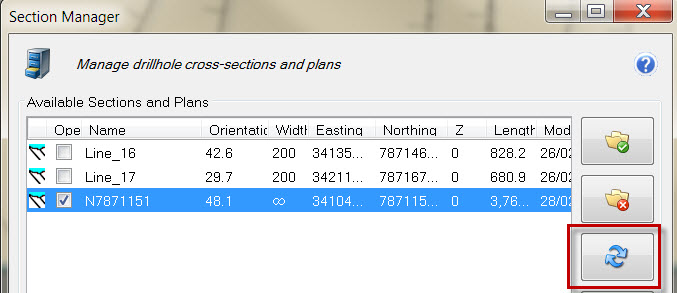
2/. If the cross/long-section already exists, you will need to first Regenerate the section to incorporate this new downhole data table, using the option in the Section Manager:
3/. Display these high grade intercepts on the section as trace shades using the Display Downhole Data tool.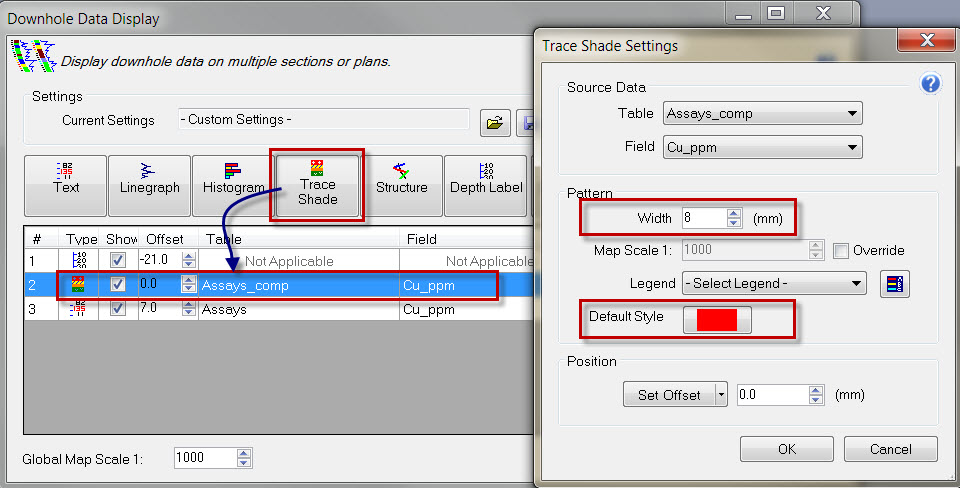
Resulting in: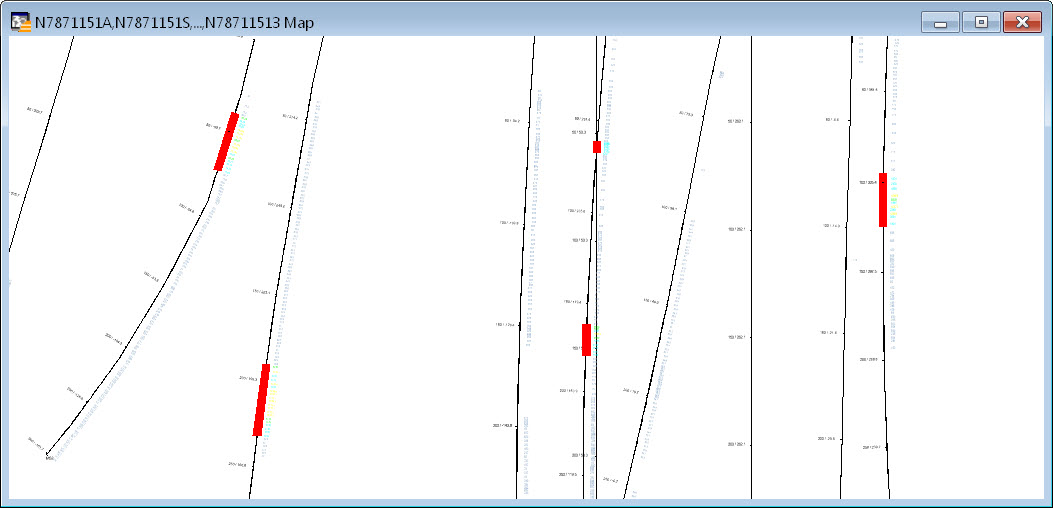
Of course, these could additionally be colour modulated by applying an appropriate 'Legend' in the Trace Shade Settings dialog (above), to rank the intercepts.
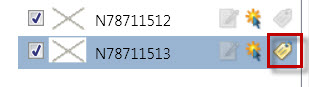
3/. In the Layer Control, use the Browse option to identify the layer containing the section-specific composited data. This will be in the format 'sectionnameX', where X is likely the largest integer suffix for the section.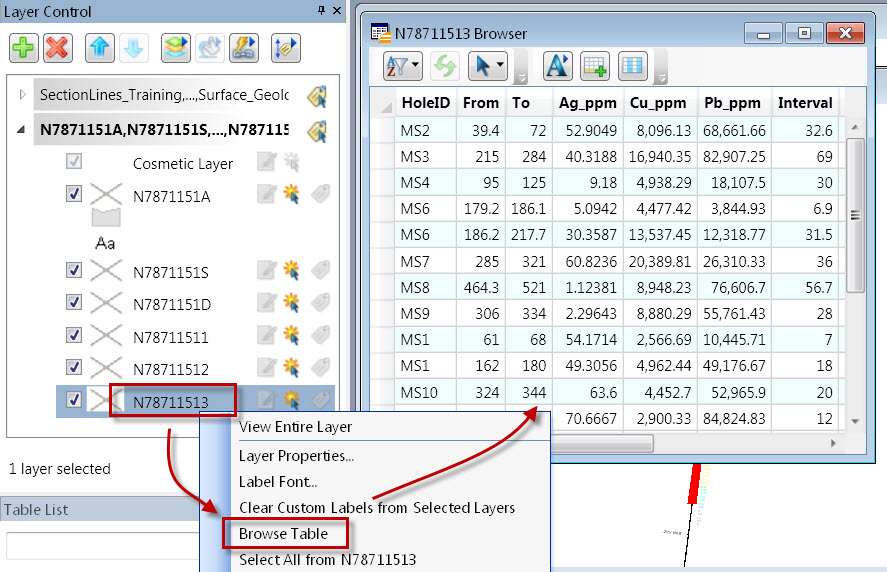
Enable Automatic Labels for this layer, and then open its Layer Properties dialog. Under the Labeling Rules tab, set an appropriate Label Offset. Then under the Label Display tab, set the label font colour and size, as well as Label Lines (such as 'Arrow').
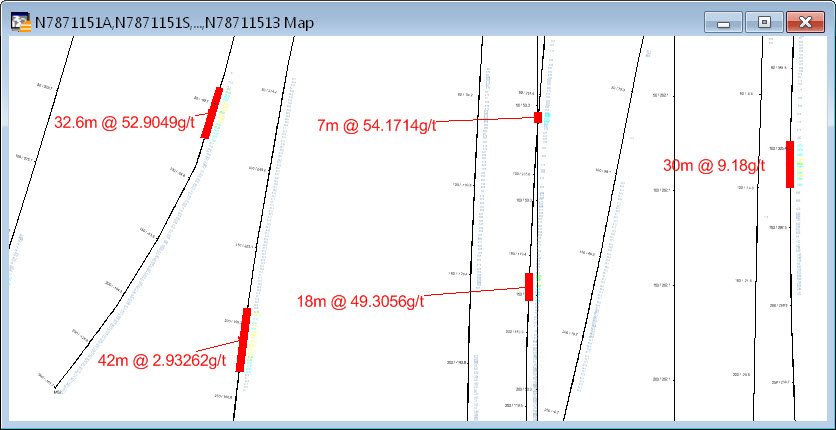
Next, open the Expression dialog next to the 'Label with:' option (Label Display tab). To label the high-grade Ag (silver) intercepts from the above pictured dataset in the format '15m @ 5.6g/t', use the following syntax: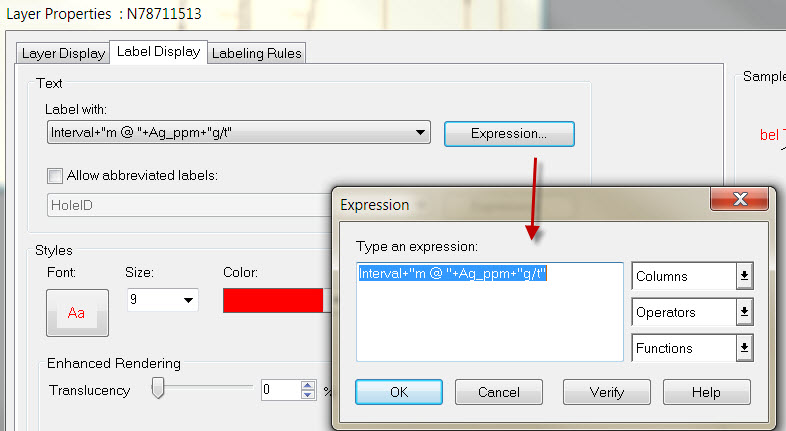
Syntax: Interval + "m @ " + Ag_ppm + "g/t"
Resulting in:
To round the silver g/t values down to only two decimal places, insert the 'Round' function as so (using a round value of 0.01):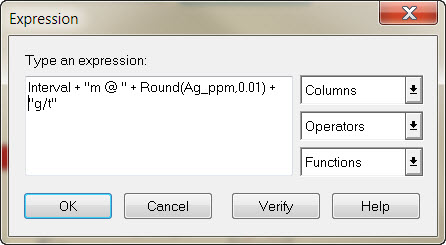
Syntax: Interval + "m @ " + Round(Ag_ppm, 0.01) + "g/t"
Resulting in:
Further examples of labeling syntax and the results :
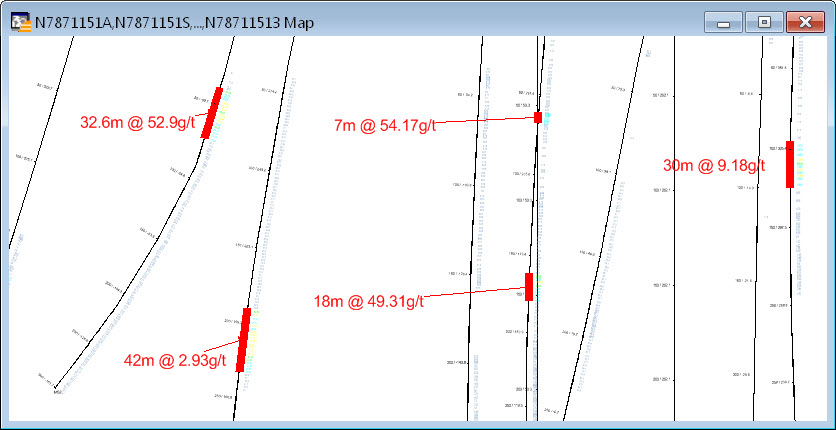
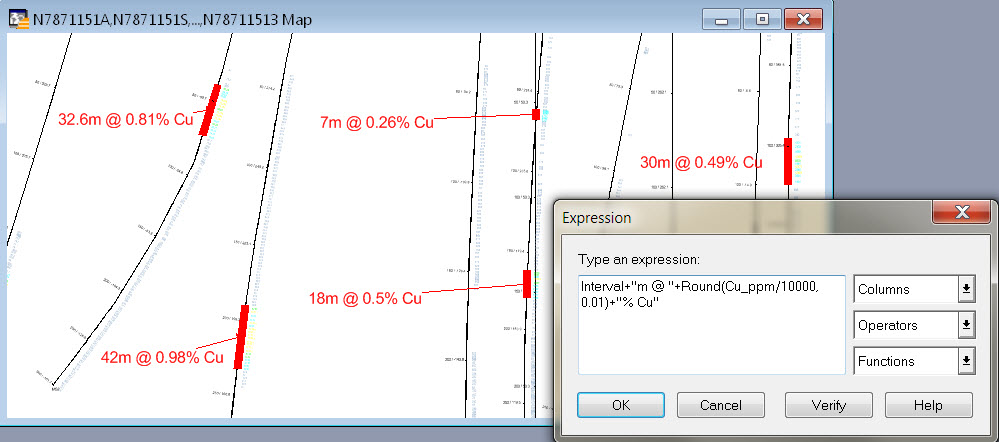
Converting ppm to percentage values
Divide the ppm value by 10000 to convert into a percentage. Then use the 'Round' function to control the number of decimal places.
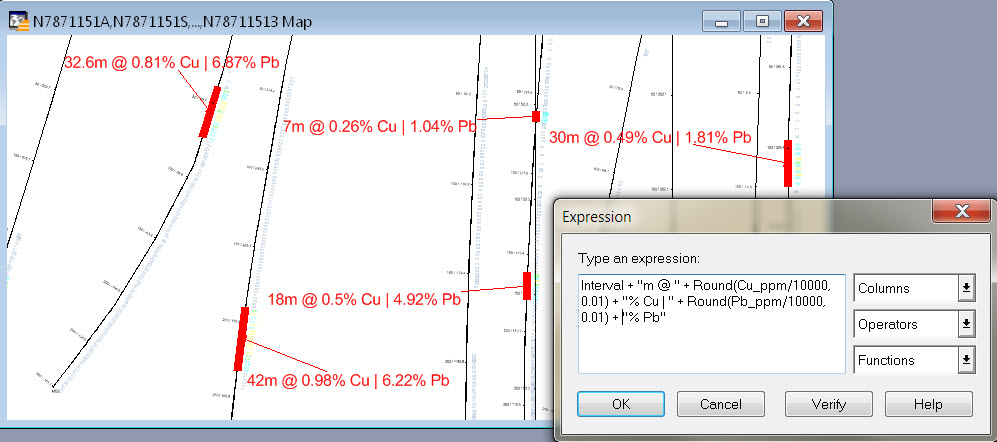
Interval + "m @ " + Round(Cu_ppm/10000, 0.01) + "% Cu"
Multiple grade values
Break up / separate multiple inserted values with an appropriate text symbol, such as " | "Interval + "m @ " + Round (Cu_ppm/10000, 0.01) + "% Cu | " + Round (Pb_ppm/10000, 0.01) + "% Pb"
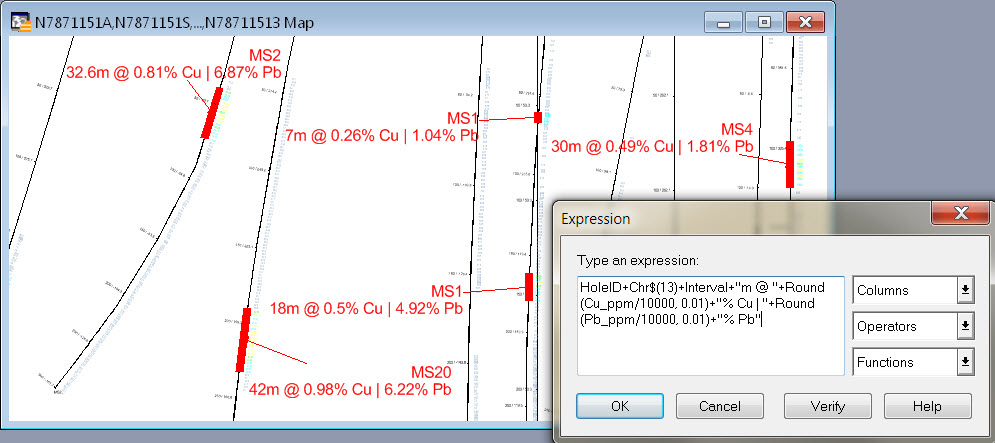
Inserting multiple lines
Insert a carriage return using the 'Chr$(13)' function
HoleID + Chr$(13) + Interval + "m @ " + Round(Cu_ppm/10000, 0.01) + "% Cu | " + Round(Pb_ppm/10000, 0.01) + "% Pb"
Saving your grade-intercept labels
These MapInfo Pro Automatic labels will not be preserved as part of a cross-section (via the Section Manager). Instead, ensure you save the labelled long/cross section/s as a Drillhole Session (using the Session Manager), naming the New session with a informative name (e.g. 'Long section with labelled grade-intercepts').


