· Calculate the grade-thickness values
· Grid these in either the long or cross section or a collar plan
· Contour this grid
The procedure is outlined in the following steps. It requires your drillhole data to be part of a Discover
Drillhole Project, with the assay data set as a downhole data table.
1) Grade*Thickness calculation
Go to Table->Maintenance->Table Structure and add 2 float columns to your Assay table called
(for example) 'Interval' and ‘Grade_thickness’.
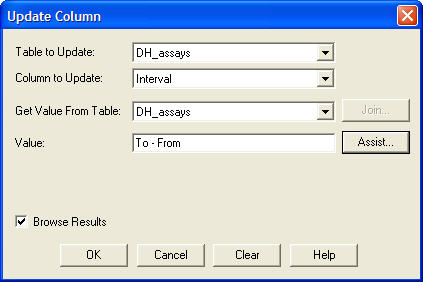
Use Table->Update Column to populate the Interval field as below (Interval = Depth_to - Depth_from).
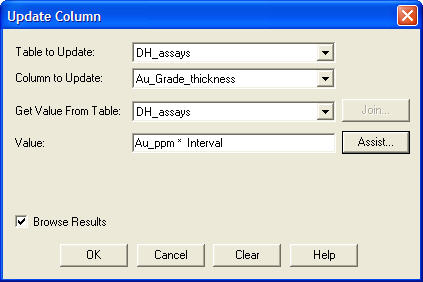
Then use the Table->Update Column to populate the Grade_thickness field as below
(Grade_thickness = Assay_field x Interval ).
Save the assay table.
2) Create the required cross/long sections or plans
Use Drillholes>Define New Section or Plan to create the sections or plans.
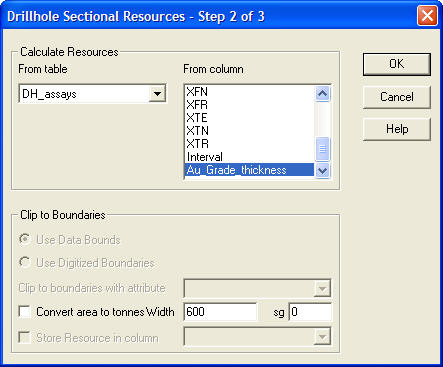
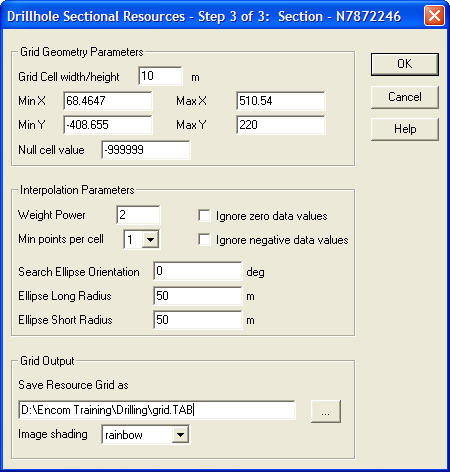
3) Create a grid of the section/plan’s grade thickness
Use the Drillholes->Sectional Resource Calculator to create a grid for the required sections/plans
using the Grade_thickness field.
4) Contour this Grade thickness grid
Use the Surfaces->Contour Grid tool to contour your grid.
Note that you may need to experiment with the Contour Intervals to get a satisfactory density of
contour lines.


