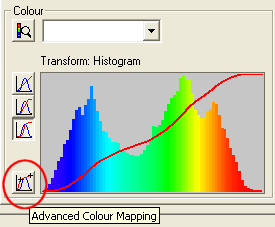
Another option available is to use the Advanced Colour Mapping option in the Grid Group Properties dialog when the Colour branch is highlighted (see below).
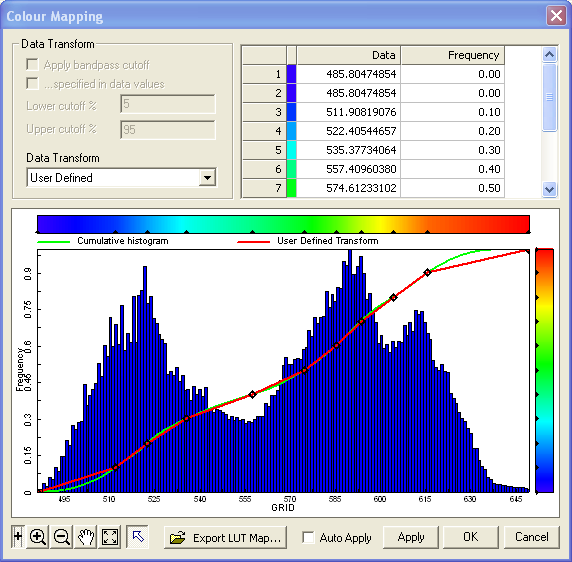
This will display the Advanced Colour mapping dialog. Selec the User defined option from the Data Transform drop-down list and manually manipulate the colour stretch by selecting and moving the nodes that appear on both the histogram and the vertical/horizontal colour frequencies (see below).